| ||||||||||||||||||||||||||||||||||||||||
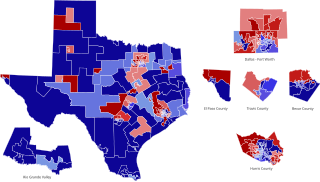
All 150 seats in the Texas House of Representatives 76 seats needed for a majority | ||||||||||||||||||||||||||||||||||||||||
|---|---|---|---|---|---|---|---|---|---|---|---|---|---|---|---|---|---|---|---|---|---|---|---|---|---|---|---|---|---|---|---|---|---|---|---|---|---|---|---|---|
| ||||||||||||||||||||||||||||||||||||||||
Democratic hold Democratic gain Republican hold Republican gain Democratic: 50–60% 60–70% 70–80% 80–90% ≥90% Republican: 50–60% 60–70% 70–80% 80–90% ≥90% | ||||||||||||||||||||||||||||||||||||||||
| ||||||||||||||||||||||||||||||||||||||||
| Elections in Texas |
|---|
 |
|
|
The 1992 Texas House of Representatives elections took place as part of the biennial United States elections. Texas voters elected state representatives in all 150 State House of Representatives districts. The winners of this election served in the 73rd Texas Legislature, with seats apportioned according to the 1990 United States census. State representatives serve for two-year terms. Democrats maintained their majority of 92 out of 150 seats. As of 2024, this is the last time Democrats won the statewide popular vote for the Texas House.


