Back مؤشر مدركات الفساد Arabic Спіс краін па індэксу ўспрымання карупцыі Byelorussian Индекс за възприятие на корупцията Bulgarian দুর্নীতির ধারণা সূচক Bengali/Bangla Índex de percepció de la corrupció Catalan Index vnímání korupce Czech Korruptionswahrnehmungsindex German Δείκτης Αντίληψης για τη Διαφθορά Greek Indico de perceptata korupto Esperanto Índice de percepción de corrupción Spanish

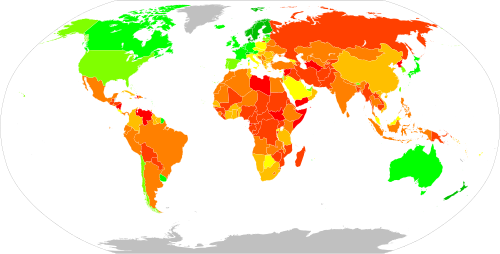
| Score higher than 89 Score equal to or between 80 and 89 Score equal to or between 70 and 79 Score equal to or between 60 and 69 Score equal to or between 50 and 59 Score equal to or between 40 and 49 | Score equal to or between 30 and 39 Score equal to or between 20 and 29 Score equal to or between 10 and 19 Score less than 10 Data unavailable |
The Corruption Perceptions Index (CPI) is an index that scores and ranks countries by their perceived levels of public sector[1] corruption, as assessed by experts and business executives.[2] The CPI generally defines corruption as an "abuse of entrusted power for private gain".[3]: 2 The index is published annually by the non-governmental organisation Transparency International since 1995.[4]
The 2023 CPI, published in January 2024, currently ranks 180 countries "on a scale from 100 (very clean) to 0 (highly corrupt)" based on the situation between 1 May 2022 and 30 April 2023. Denmark, Finland, New Zealand, Norway, Singapore, and Sweden are perceived as the least corrupt nations in the world, ranking consistently high among international financial transparency, while the most apparently corrupt are Syria, South Sudan, and Venezuela (scoring 13), as well as Somalia (scoring 11).[5]
Although the CPI is currently the most widely used indicator of corruption globally, it is worth emphasizing that there are some limitations. First, the CPI does not distinguish between individual types of corruption (some are not even included in the index) and people's perceptions do not necessarily correspond to the actual level of corruption. To get a more comprehensive picture, the CPI should be used alongside other assessments. Furthermore, the CPI is better suited for analyzing long-term trends, as perceptions tend to change slowly.[6]
- ^ "Corruption Perception Index". transparency.org. Retrieved 28 January 2020.
- ^ "Corruption Perceptions Index: Frequently Asked Questions". Transparency International. 2024. Archived from the original on 3 June 2024. Retrieved 20 July 2024.
- ^ Cite error: The named reference
cpilongwas invoked but never defined (see the help page). - ^ "1995 – CPI". Transparency.org. Retrieved 7 July 2022.
- ^ Cite error: The named reference
ti_2023was invoked but never defined (see the help page). - ^ Andy McDevitt. (2016). How-to guide for corruption assessment tools (2nd edition). U4 operated by Transparency International.