Back Graphzeichnen German Dibujo de grafos Spanish رسم گراف Persian Tracé de graphes French Raffigurazione di un grafo Italian 그래프 그리기 Korean Визуализация графов Russian கோட்டுரு வரைபடம் Tamil Pagguhit ng grap Tagalog Візуалізація графів Ukrainian

Graph drawing is an area of mathematics and computer science combining methods from geometric graph theory and information visualization to derive two-dimensional depictions of graphs arising from applications such as social network analysis, cartography, linguistics, and bioinformatics.[1]
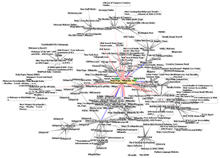
A drawing of a graph or network diagram is a pictorial representation of the vertices and edges of a graph. This drawing should not be confused with the graph itself: very different layouts can correspond to the same graph.[2] In the abstract, all that matters is which pairs of vertices are connected by edges. In the concrete, however, the arrangement of these vertices and edges within a drawing affects its understandability, usability, fabrication cost, and aesthetics.[3] The problem gets worse if the graph changes over time by adding and deleting edges (dynamic graph drawing) and the goal is to preserve the user's mental map.[4]
- ^ Di Battista et al. (1998), pp. vii–viii; Herman, Melançon & Marshall (2000), Section 1.1, "Typical Application Areas".
- ^ Di Battista et al. (1998), p. 6.
- ^ Cite error: The named reference
dett-viiiwas invoked but never defined (see the help page). - ^ Misue et al. (1995).