Back خريطة ذاتية التنظيم Arabic Mapa autoorganitzat Catalan Samoorganizující neuronová síť Czech Selbstorganisierende Karte German Mapa autoorganizado Spanish نقشههای خودسازماندهنده Persian Itseorganisoituva kartta Finnish Carte autoadaptative French רשת קוהונן HE Mappa auto-organizzata Italian
| Part of a series on |
| Machine learning and data mining |
|---|
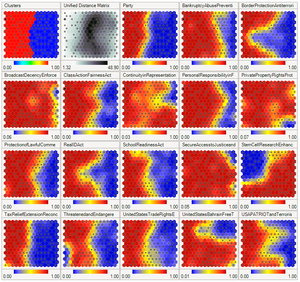
A self-organizing map (SOM) or self-organizing feature map (SOFM) is an unsupervised machine learning technique used to produce a low-dimensional (typically two-dimensional) representation of a higher-dimensional data set while preserving the topological structure of the data. For example, a data set with variables measured in observations could be represented as clusters of observations with similar values for the variables. These clusters then could be visualized as a two-dimensional "map" such that observations in proximal clusters have more similar values than observations in distal clusters. This can make high-dimensional data easier to visualize and analyze.
An SOM is a type of artificial neural network but is trained using competitive learning rather than the error-correction learning (e.g., backpropagation with gradient descent) used by other artificial neural networks. The SOM was introduced by the Finnish professor Teuvo Kohonen in the 1980s and therefore is sometimes called a Kohonen map or Kohonen network.[1][2] The Kohonen map or network is a computationally convenient abstraction building on biological models of neural systems from the 1970s[3] and morphogenesis models dating back to Alan Turing in the 1950s.[4] SOMs create internal representations reminiscent of the cortical homunculus[citation needed], a distorted representation of the human body, based on a neurological "map" of the areas and proportions of the human brain dedicated to processing sensory functions, for different parts of the body.

- ^ Kohonen, Teuvo; Honkela, Timo (2007). "Kohonen Network". Scholarpedia. 2 (1): 1568. Bibcode:2007SchpJ...2.1568K. doi:10.4249/scholarpedia.1568.
- ^ Kohonen, Teuvo (1982). "Self-Organized Formation of Topologically Correct Feature Maps". Biological Cybernetics. 43 (1): 59–69. doi:10.1007/bf00337288. S2CID 206775459.
- ^ Von der Malsburg, C (1973). "Self-organization of orientation sensitive cells in the striate cortex". Kybernetik. 14 (2): 85–100. doi:10.1007/bf00288907. PMID 4786750. S2CID 3351573.
- ^ Turing, Alan (1952). "The chemical basis of morphogenesis". Phil. Trans. R. Soc. 237 (641): 37–72. Bibcode:1952RSPTB.237...37T. doi:10.1098/rstb.1952.0012.

